In TORSH Talent, we offer several pre-built visual data Dashboards via Insights. These dashboards track various reporting metrics of activity totals and scores over time in your system for a pleasing and easy to use display.
To reach these dashboards, navigate to 'Insights' in the top navigation bar. By default, you should be brought to the 'Dashboards' tab of the Report Builder Hub. From here, click on a specific dashboard you would like to filter and display your visual data for!

Dashboards:
Rubrics & Observations Insights
The Rubrics & Observations Insights dashboard provides an easy way to display visualization of average scores for specific rubrics/frameworks completed in your system.
To generate your data, please filter for a specific Date Range. Then select a specific Rubric/Framework.
In this dashboard, you can filter for the following:
-
Date Range*
-
Rubric/Framework*
-
Formality (Optional)
-
Roles (Optional)
-
Groups (Optional)
-
Users (Optional)
-
Event Types (Optional

After the data for your specific Rubric within the chosen Date Range has generated, you will first see a collection of circle graphs totaling Average Scores in both the Top Domain (section) and Top Dimension (Criteria) earned using this rubric template. We also provide the Lowest Domain and Lowest Dimension score averages, as well as a total count of observation forms and self assessment forms completed using this template.

Scrolling down further is a table that displays each Domain and their Average Scores. Clicking on the '+' icons beside each Domain will reveal their respective Criteria and a bar graph depicting the average score totals within those criteria.

At the bottom of the Rubrics & Observations Insights dashboard is a line graph depicting Average Score Over Time for an easy reference of trending data within the Date Range you set. You can also filter this activity based on specific Domains and/or Dimensions of the Rubric/Framework you selected to view.

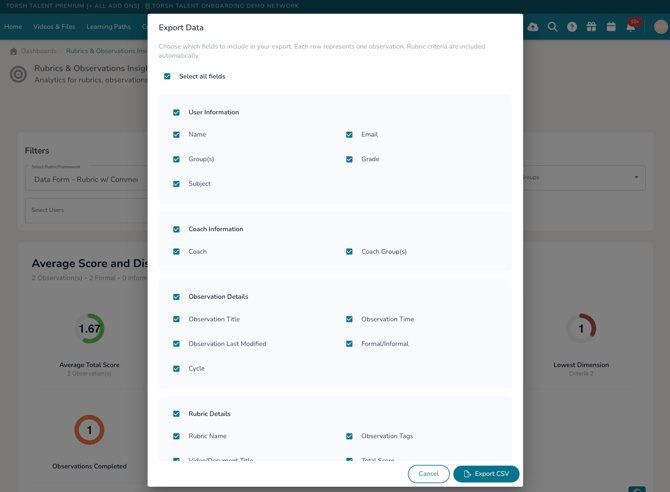
Lastly, you can export a CSV spreadsheet of this specific rubric's completion data by scrolling up to the top of the dashboard and clicking the 'Export' button.

Doing so will provide a pop-up wherein you can select the specific columns to produce in the generated CSV file for rubric completion.
Coaching Insights
The Coaching Insights dashboard is ideal for generating a quick total of Goal, Action Step, Observation, and Data Form completion within the Date Range you set.

Goals Insights
The Goals Insights dashboard is a great reference for goal creation and action step completion in your system over time. Filter for a specific Date Range at the top, and your pie graphs will generate.
Hover over each segmented color of the pie graph to see the specific totals.

Account Activity Insights
The Account Activity Insights dashboard is a simple bar graph depicting a total count of Accounts Created in the system within the Date Range you filter for.

Learning Paths Insights
The Learning Paths Insights dashboard provides a visual reference of Learning Path activity within the Date Range you filter for. You can also export this activity as a CSV spreadsheet.
This dashboard displays total counts for Total Access Count (the total number of modules accessed), Total Certificates Issued, Total Pages Completed, Total Responses Made. We also display a pie graph of Learning Path Modules Started vs Completed as well as Learning Path Courses Started vs Completed.

Videos & Files Activity Insights
The Videos & Files Activity Insights dashboard provides a comprehensive total of previous video/file activity versus current video/file activity based on the Date Range you select. You can also filter for specific Roles and Groups, if needed.
The first set of bar graphs provide totals for Video Uploads, Videos Watched, and Minutes Played from that watch activity in the system.

Scrolling down further, you will find more totals for Videos Shared, Files Uploaded, Files Viewed, Video Comments, Videos w/ Comments, Video Attachments, and Rubric Tags (within Videos).
